Jeffrey M. Lichtman jmlras at mindspring dot com
and Carl Lyster ctlyster at comcast dot net
Data may be displayed using conventional methods such as DOS, Windows Excel, or customized software for the system in use. In addition, data results will vary with different antenna types and aperture.
The Antenna - For instance, the resolving power of a 26 meter dish antenna will be much greater than that of a smaller aperture antenna. Taking a note from the optical astronomy community, a reflector type mirror measuring 12 inches diameter, will gather more light that one measuring six inches diameter. This is the same analogy with antennas.
When trying to resolve Hydrogen clouds at 1420.405 MHz, using a three meter dish antenna, one will be able to resolve multiple clouds. When using a 1.6 meter antenna, he same objects will be seen but, they will appear as a single object.
Analog to Digital Data Conversion Method - Also referred to as quantisation. A process in which a continuous signal is converted to a series of points at discrete levels and converted to a series of binary integers. The receivers in use are 12 Bit Technology.
The results pictured below were all done on a Spectral type receiver (RAS SpectraCyberTM or UltraCyberTM) and using different size antennas. Again, results may vary from the receiver used by the observer. ie; ICOM8500 or RAS SpectraCyberTM, as well as, the software and signal processing methods. In addition, the RAS receivers have superior image rejection.
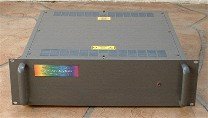
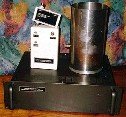
RAS SpectraCyberTM (left) and UltraCyberTM (right)
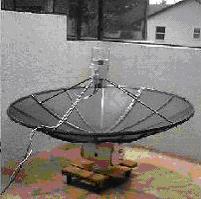
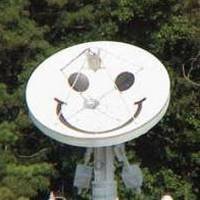
Antennas used for Observation
Left - 1.6 meter (Villa RO); Right - 5 meter (PARI)
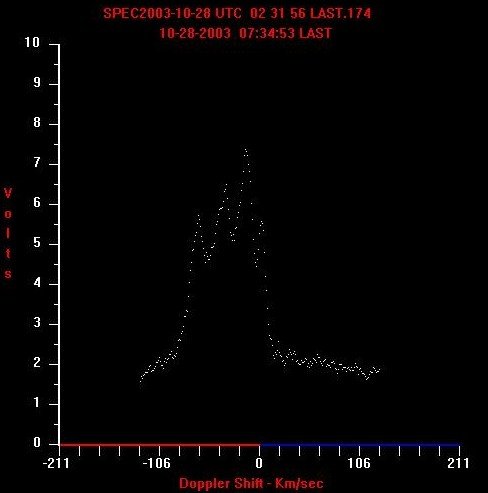
Hydrogen Line Spectral Scan with 10-foot Dish

SpectraCyberTM Fire Plot -- Modified SpectraCyberTM Software
(Stephen F. Austin University, Michal Johnson and Dan Bruton
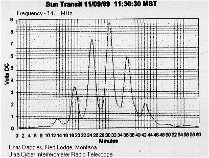
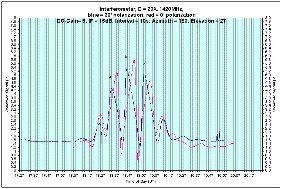
Solar Interferemoter Fringes by Chris Dapples (left); Rodney Howe (right)
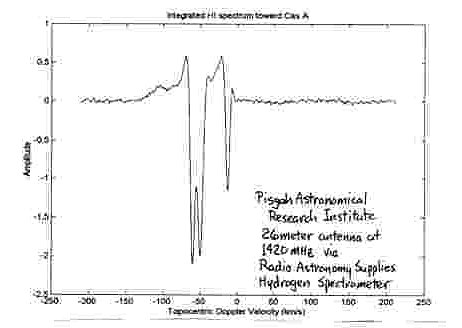
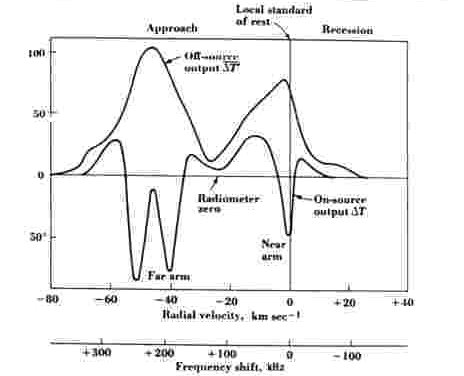
Hydrogen spectra taken at PARI (left); from Dr. John Kraus, Ohio State (right)

Spectral scan plotted in Excel, by Dr. John Bernard
Webmaster's Note: Some of the above links will take you off the SARA website. The Society of Amateur Radio Astronomers is not responsible for material hosted on other individual's or organization's websites, but links to them as a courtesy. To enable you to return here, you may wish to open these links in a separate browser.
SARA members who wish their projects linked from this page should email the webmaster, indicating the URL and project details.
